How can Insights section help me?
What is Insights section?
With our Insights section, you can now review relevant analytics related to your form. Insights section is meant to help you get more information on the performance of your form, making it easier for you to assess if the form needs to have some changes in order to be more successful.
How do I get to Insights section?
If you are in My Forms, you can easily navigate to Insights section by hovering over the form you are interested in and clicking on Results. Let’s say you are in Editor -> the same applies, by clicking on Results you will be redirected to Insights section.
From the Insights page, you can check your Submissions or Reports, so you have all the collected data in one place.
What does it offer?
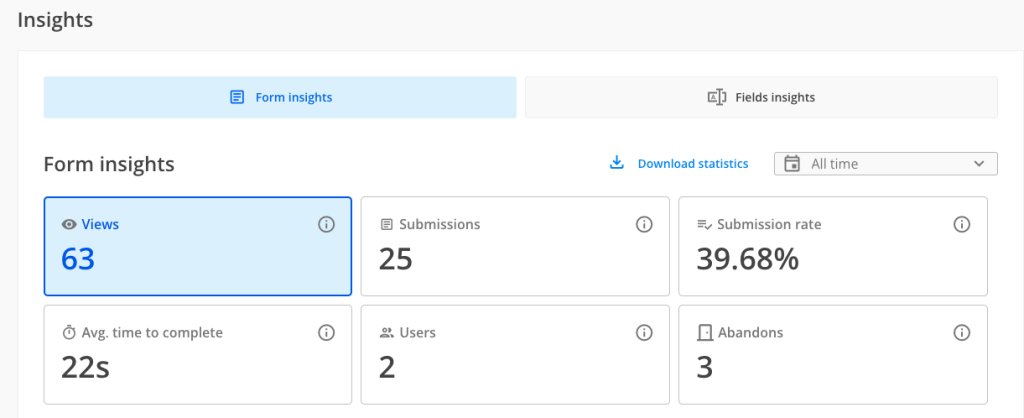
Form insights
Views: this represents the number of views your form has registered. Please keep in mind that this registers all views, not unique ones.
Submissions: this represents the number of submissions your form has collected.
Submission rate: this is calculated taking into consideration the total number of submissions and the total number of views.
Average time to complete: this takes into consideration how much time it took your respondents to complete the form, displaying an average of all submissions.
Users: this represents the number of respondents who interacted with at least one field from your form
Abandons: this represents the number of respondents who interacted with at least one field from your form, but did not submit the form
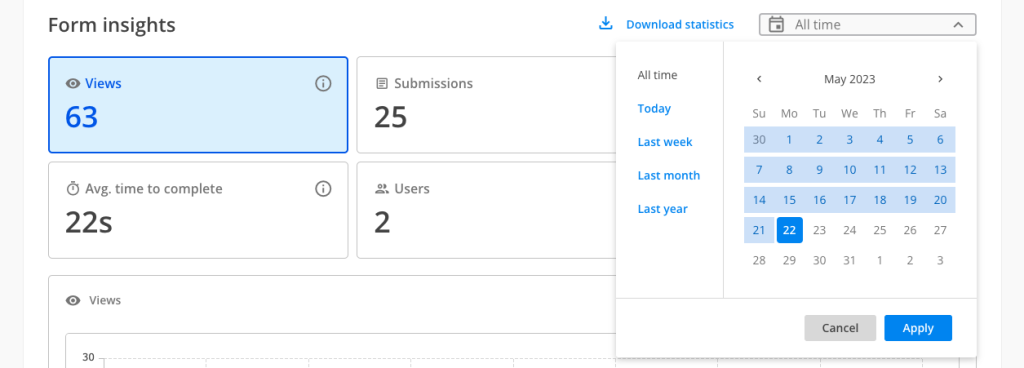
By using the date picker, you can select the time frame you are interested in. We are offering predefined timeframes, such as Last week, Last month, Last year.
Form insights charts
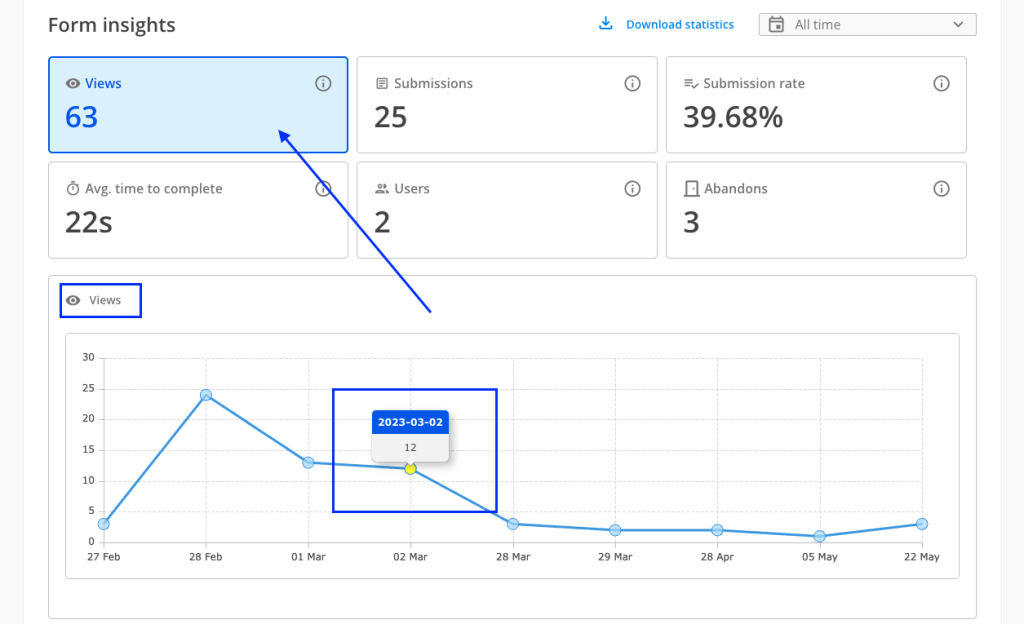
Below the form stats, for an easier visualisation, Insights section offers charts for each type of form stat. By clicking on each Form insights card one by one, the chart will display the data for the selected card on a chart.
When hovering over the bullet points on charts, you can easily see the date and the form stat data.
Download statistics
If you are interested in quickly sharing the stats of your form with somebody else, you can use the Download statistics feature. Once clicked, it will open up a dropdown from where you can select PDF format. A PDF will automatically download within browser with a snapshot with your current filters that are applied on Form Insights.
Devices, Referrer, Location
Based on the card selection, below Insights charts, we are displaying information related to the devices your respondents have viewed and submitted the form from, the referrers that have led them to your form and the location from which they have viewed & submitted the form from.
Device card
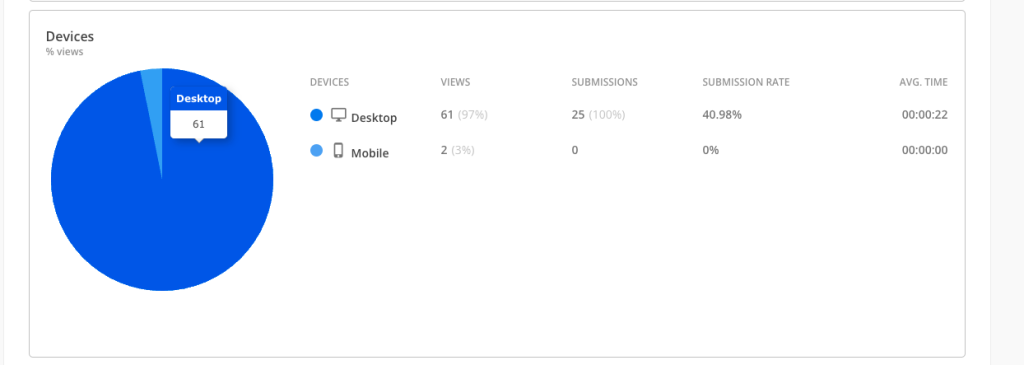
In the below example, the Views card has been selected in Insights. As such, the Devices card shows the information for views. For example, from Desktop, our form has registered 61 views (97% of total number of views registered on the form) and from Mobile we have 2 views (3% out of total number of views registered on the form). Also, you can hover on the pie chart to see exactly each slice data.
The entries are displayed in descending order based on the card’s selection (in this case, based on Views).
Referrer card
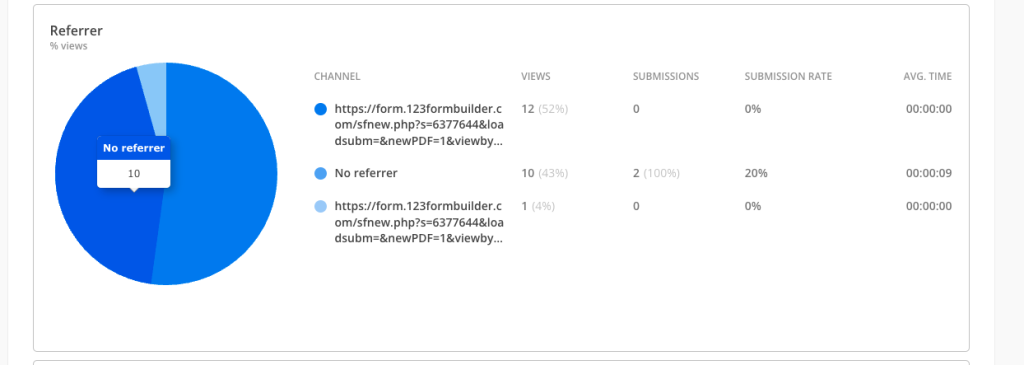
Following the above example, our form has registered 3 different referrers that are placed in descending order based on the card selection (in our example, the Views card is selected). When hovering over the pie slice, you have the value for each referrer.
Note: if we can not detect a specific referrer (e.g: the form has been accessed/completed directly from the form link), then we are using the No referrer terminology. This is only one example and not limited to this scenario only.
Location card
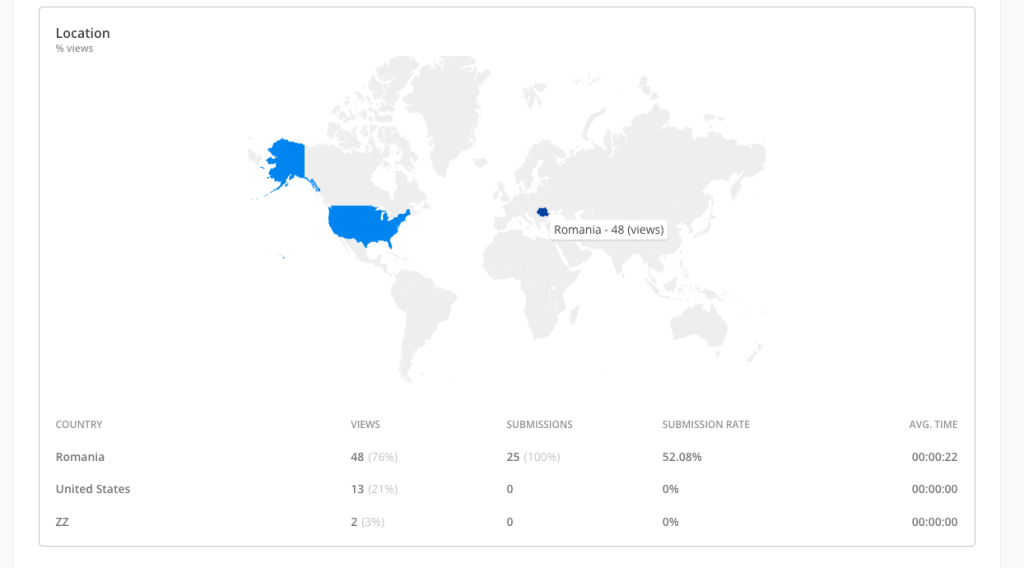
Following the above example, our form has registered 3 different locations that are placed in descending order based on the card selection (in our example, the Views card is selected). When hovering over the map, we can see the country name and the data that belongs to it.
Note: if we can not detect the country from which the form has been viewed/submitted, the Country will be displayed as ZZ in the location table info.
Note: currently, we are offering the device, location & referrer information only for Views, Submissions, Submission rate & Avg time.
Fields insights
Fields insights section offers you in-depth form analytics. Here you have access to the performance of each question that is currently on your form. For more details on how it works and how to interpret the data, please check this article.

How does it help me?
Let’s say you have created your form and shared it with your respondents, but no submission is coming through. By using the Insights section, you can now check if your respondents have viewed your form or not so you can take action by following-up with them.
If your form has gathered a lot of views, but no submissions, maybe there is something that is stopping respondents from submitting the form.
Having a high average time to complete the form could be a warning for you: respondents might abandon submitting your form because it takes too long to be completed.
The number of users that interact with your form is quite important, as when compared with the total number of views, it tells you how appealing the form is, how much your respondents interact with it or only look at it and abandon submitting it. The number of abandons tells you that your respondents have interacted with your form, but something has prevented them from submitting it – either there is a problem with the form itself (wrong validations, Submit button not being displayed correctly, various reasons and scenarios) or your respondents have a different reason why they do not want to submit their information (here each case needs to be treated independently as it may vary from form to form).
By paying attention to all these details, you can improve your form so you can have as many submissions as possible and get value out of it.
Release dates
On EU server, Insights section is available for forms created after 9th of November 2022.
Forms created before the above dates will have incomplete data, starting from the release date until the present day.
Importing submissions
Related articles:
2 comments
Leave a Reply
Your email address will not be published.
Similar Articles
Frequently Asked Questions
Here is a list of the most frequently asked questions. For more FAQs, please browse through the FAQs page.

I would like to see the names & contact of people in view. Is that possible?
Hi there! Please reach out to us at customercare@123formbuilder.com with more details about your request. Once we have that information, we’ll ensure it’s addressed as quickly as possible.